
excel表格统计数据的方法
相关话题
Excel中经常需要为数据进行统计处理,数据统计具体该如何进行操作呢?下面是由小编分享的excel表格统计数据的方法,以供大家阅读和学习。
excel表格统计数据方法:
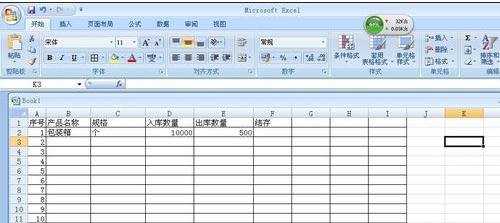
统计数据步骤1:打一个excel表格表格,如图,简单的结存统计
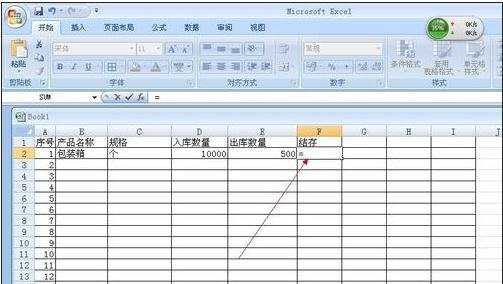
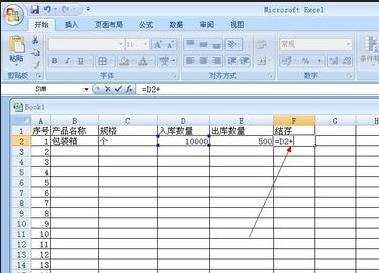
统计数据步骤2:要想做结存统计,先在结存下面的表格中输入“=”如图
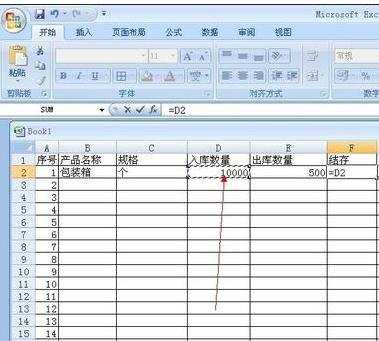
统计数据步骤3:我们统计的就是上期结存数量+入库数量-出库数量=现在结存数量,
把鼠标点在“入库数量”如图
这时会一个虚线
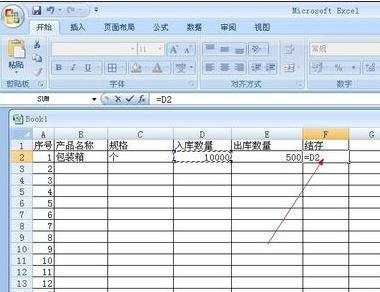
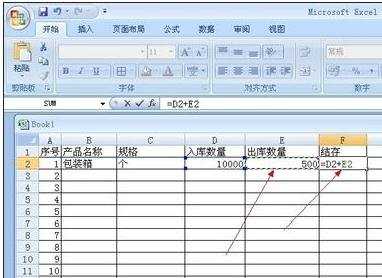
统计数据步骤4:然后在键头所指的后面填写“+”号如图
统计数据步骤5:然后在把鼠标点在“出库数量”上,如图
统计数据步骤6:这时在结存框的“+”号后面出现一个E2,这个E2就是刚才点击的出库数量的方格。如图
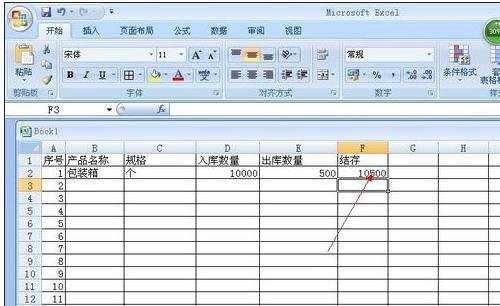
统计数据步骤7:然后按Enter键,这样统计数据就计算出来了。
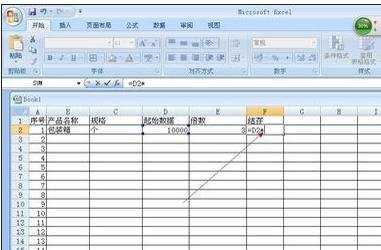
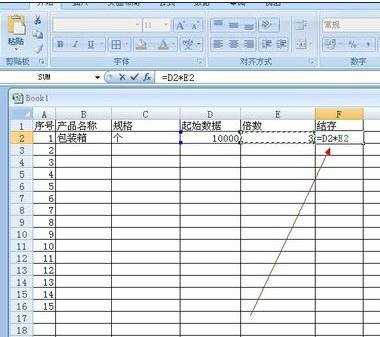
统计数据步骤8:同样的道理,如果是相乘的形式,也是可以的,如图
我们出计算倍数关系。
重复2,3,4,只要点击过起数据后放一个乘号,如图
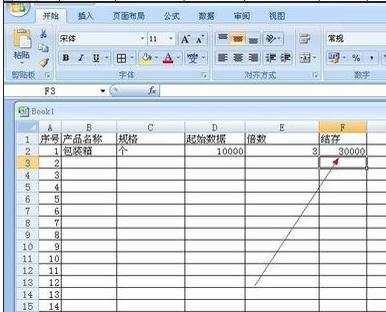
统计数据步骤9:再点击倍数表格,如图
最后按下Enter键,这样就可以计算出了倍数关系的统计数据了。
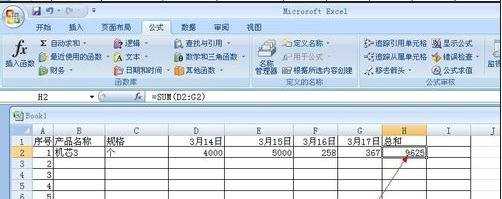
统计数据步骤10:如果统计的数据是单一的求和或平均值等,就更简单了,如图
我们如果想求这种机芯的这几天的总和,
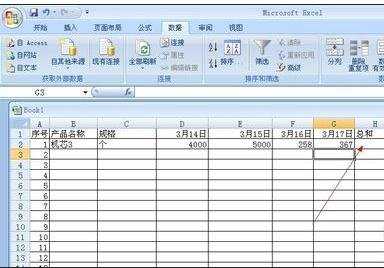
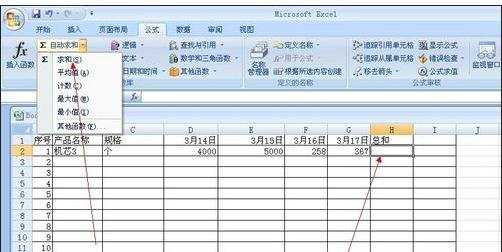
统计数据步骤11:只要把鼠标点击一下求和下面的方框,然后点击键所指的公式,求和,这样就可以求和了。如图
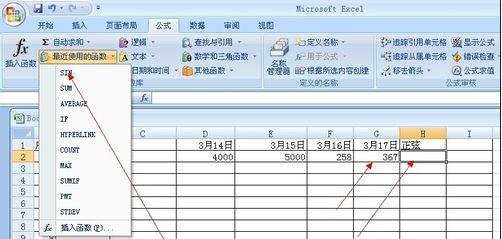
统计数据步骤12:如果想求一个数据的正弦、余弦、正切、余切函数,同样的道理,如图
比如求3月17日的正弦函数,
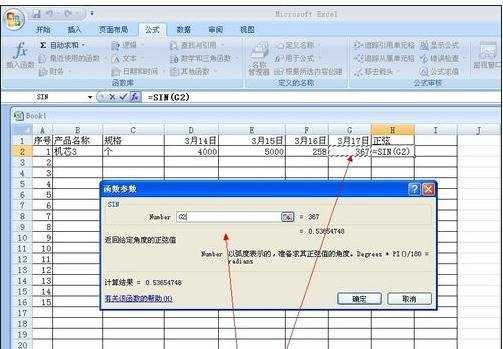
统计数据步骤13:按照键头所指的点击,会再现这样的对话框,如图
统计数据步骤14:再点击3月17日下面的数据即可,如图
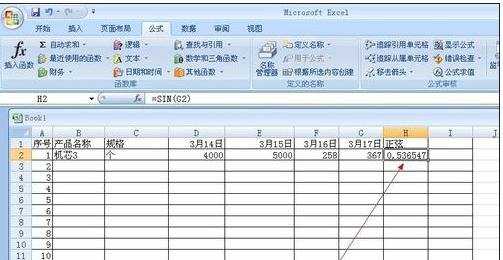
统计数据步骤15:点击确定,这样正弦数据就计算出来了。
看了excel表格统计数据的方法还看了:
1.怎样在excel表格中统计数据
2.如何用excel统计分类数据的方法
3.excel表格统计数据的教程
4.如何在excel中统计数据进行数据分析
5.excel表格里数据统计的教程
6.如何在excel中统计报表
7.excel中统计人数的方法
excel表格统计数据的方法的评论条评论