
怎么在Excel中制作对比图
发布时间:2017-03-19 11:26
相关话题
在工作及学习中我们常常用到Excel制作对比图来很直观的反映两个或多个控制因素对一个结果的影响程度,具体怎么做呢?下面小编来告诉你。
在Excel中制作对比图的步骤:
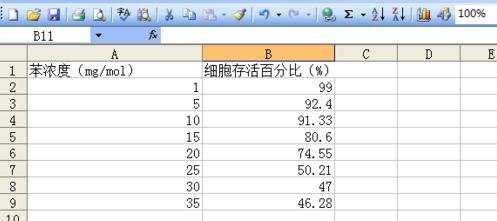
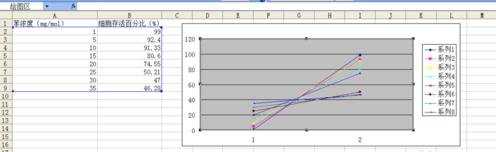
将要做的图例数据输入表中,如图所示
点击"插入"---"图表",选择想要的格式,如想得到数据之间的关系可以插入折线图。


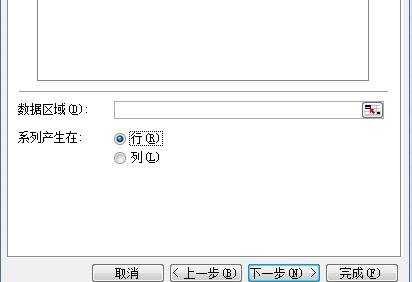
点击“下一步”-----然后选择所要的行或者列------点击“数据”----
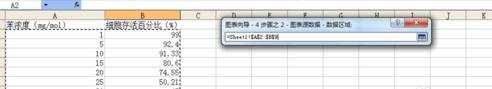
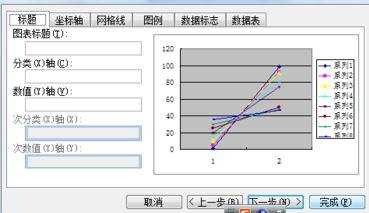
接着点“下一步”
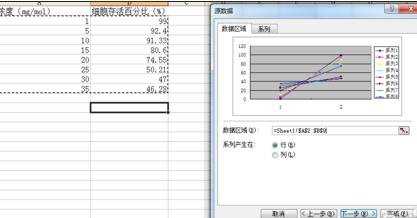
接着点“下一步”
点击“完成”

怎么在Excel中制作对比图的评论条评论