
Excel如何设置表格显示曲线函数公式
发布时间:2017-06-01 13:24
有时候,当我们拟合好图线后,需要其系数或斜率,这时候,用excel是可以直接显示的,不需要自己估算,下面小编马上就告诉大家Excel设置显示曲线函数表达式的方法,希望看完本教程的朋友都能学会并运用起来。
Excel表格设置显示曲线函数表达式的方法
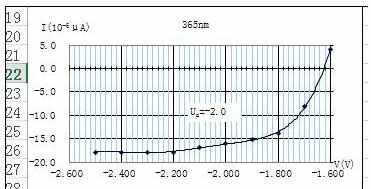
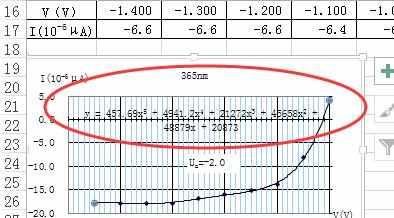
首先你得拟合好一个曲线图。
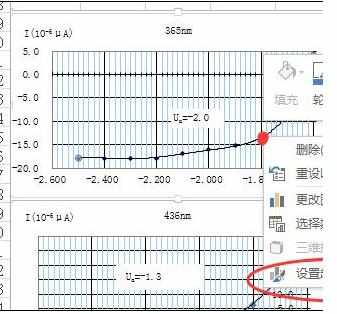
鼠标移到曲线上,右击,选择“设置趋势曲线格式”。
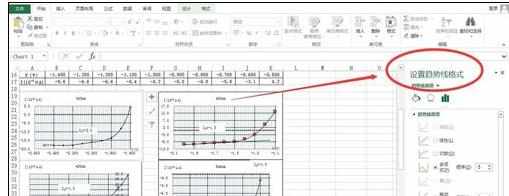
在右侧显示的设置趋势曲线格式下,勾选“显示公式”。
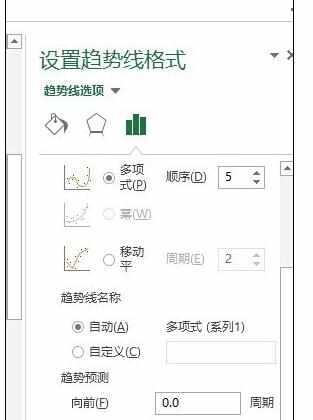
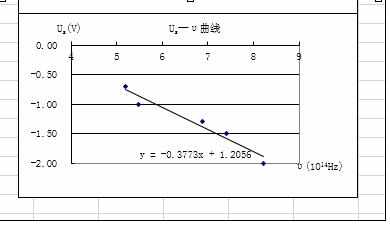
勾选后,图像上就会显示公式了。
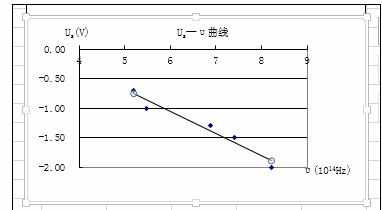
同样的方法也可以用于直线上。
猜你感兴趣:
1.Excel表格曲线函数公式怎么设置为显示
2.excel生成函数曲线的教程
3.Excel中表格利用函数画出曲线的操作技巧
4.excel设置表格显示计算公式的教程
Excel如何设置表格显示曲线函数公式的评论条评论