
怎么在excel2013中使用推荐的图表
发布时间:2016-11-10 10:40
相关话题
在Excel表格中,我们知道数据该使用什么样图表的时候,可以直接选择相应的图表。如果我们不知道数据该使用什么样的图表时候,可以使用Excel推荐的图表。下面小编教你怎么在excel2013中使用推荐的图表.
excel2013中使用推荐的图表的步骤:
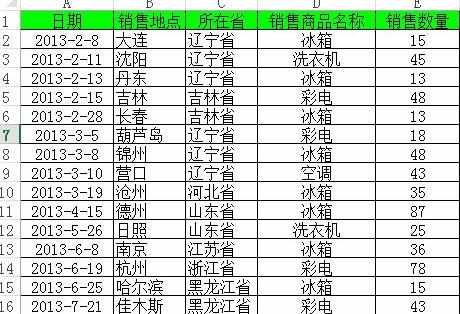
启动Excel2013,例如有如下图所示的表格。
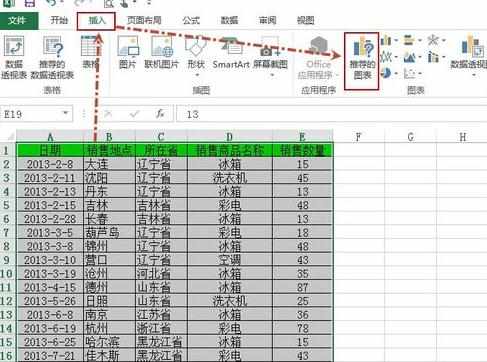
选中表格全部列或部分列,这里以全部列为例,然后单击“插入”选项卡中的“推荐的图表”。
说明:如果你知道用什么图表,可以单击“插入”选项卡下“图表”组中对应的图表即可。
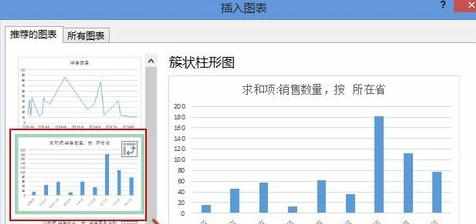
这时候打开“插入图表”对话框,左侧显示推荐的图表,选择一个你需要的图表,然后单击“确定”。
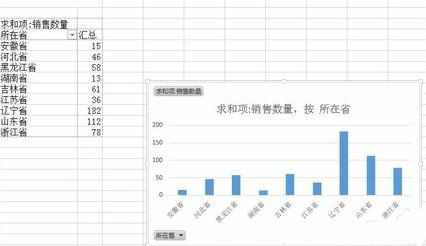
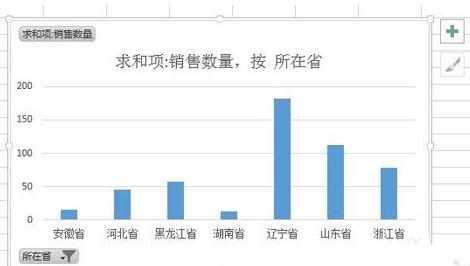
效果如下图所示。
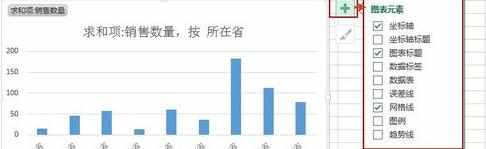
设置图表元素:选中图表,单击加号,可以选择图表元素(根据需要来选择)。
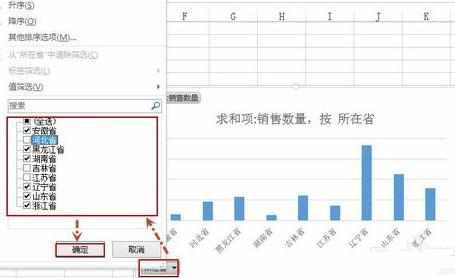
选择图表要显示的数据:单击图表下方“所在省”,在打开的界面中选择你要显示的省份,然后单击“确定”。
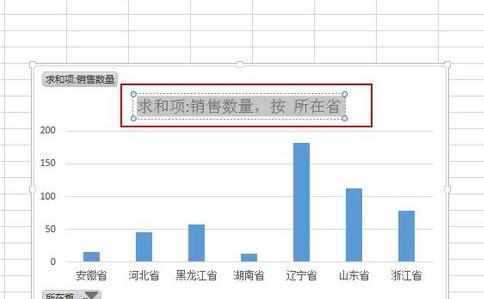
修改图表的标题:单击图表标题,进入编辑状态,重新输入标题即可。
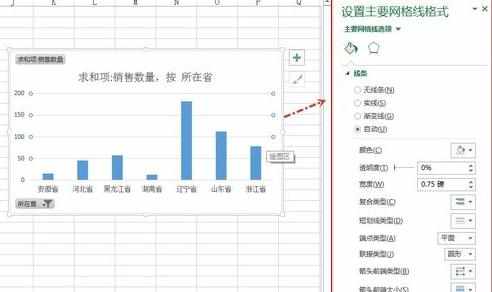
设置图表格式:双击图表中对应的部分(如网格线),右侧会显示格式设置界面,进行设置即可。
说明:图表的其他部分设置类似。
怎么在excel2013中使用推荐的图表的评论条评论