
ppt如何制作立体馅饼图
发布时间:2017-04-06 20:13
相关话题
由于便于统计的原因我们有时需要利用图形来显示你要说明的数字,这样更加的形象直观的观察出你要表达的内容,一般分为柱状图、饼状图、面积图、折线图等,下面小编就教你怎么在ppt中制作饼状图。
在ppt制作立体馅饼图教程
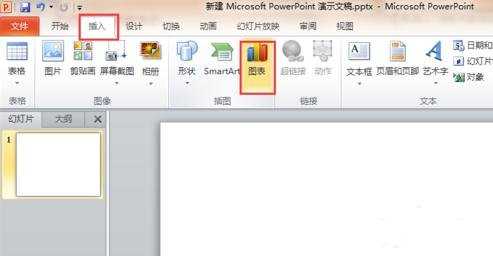
打开PPT,点击“插入”——点击“图表”
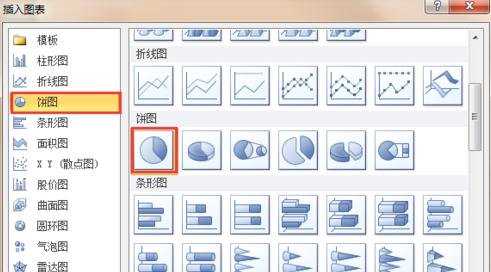
弹出“插入图表”选择框,选择“饼图”,选择一种样式,点击“确定”
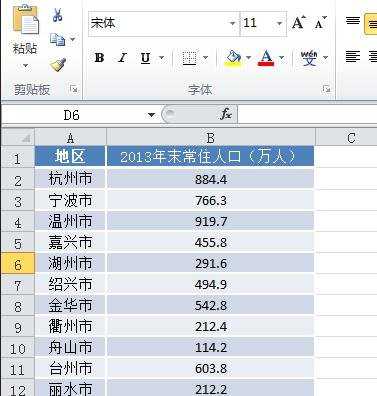
弹出EXCEL后填写数据信息
完成输入录入后回到PPT 我们就可以看到对应的饼形图了
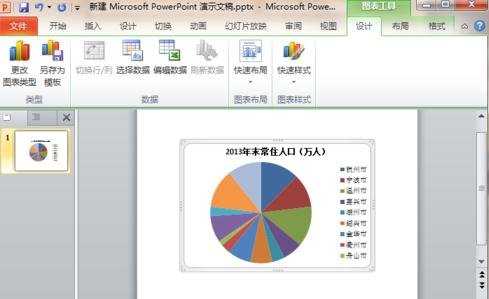
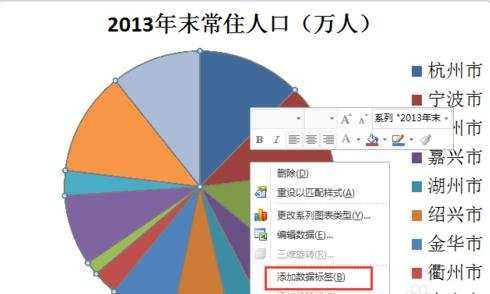
这个时候的图是没有数据的,我们需要右键点击“添加数据标签”,这样就可以出来数据了
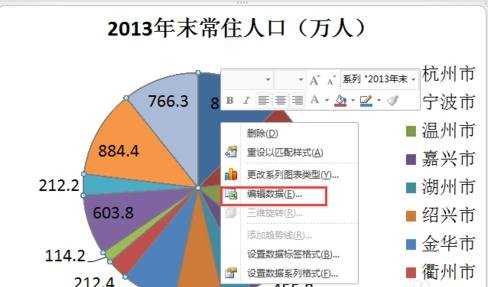
如果要修改数据,右键点击“编辑数据”,重新弹出EXCEL表格后修改数据
ppt如何制作立体馅饼图的评论条评论