
word怎么插入统计图的两种方法
发布时间:2016-12-12 16:11
相关话题
画统计图表我们一般会用Excel,但是其实Word也可以画统计图表,其功能也不弱。那么下面就由小编给大家分享下word插入统计图的技巧,希望能帮助到您。
word插入统计图方法一:
步骤一:首先呢,在桌面空白处右击鼠标点击“新建”中的“Microsoft Word文档”(看下图),这就是新建word文档,然后双击打开

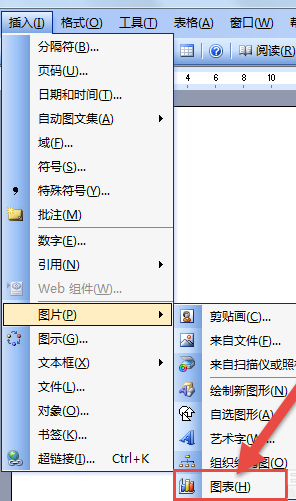
步骤二:然后呢,打开word文档,找到菜单“插入”中的“图表”点击进入(看下图)

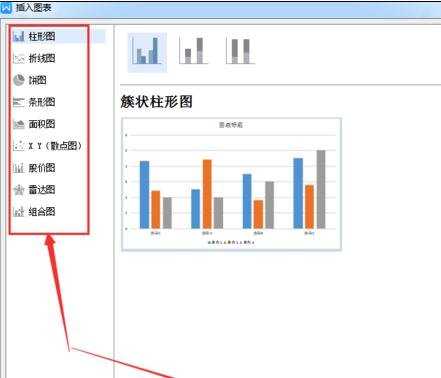
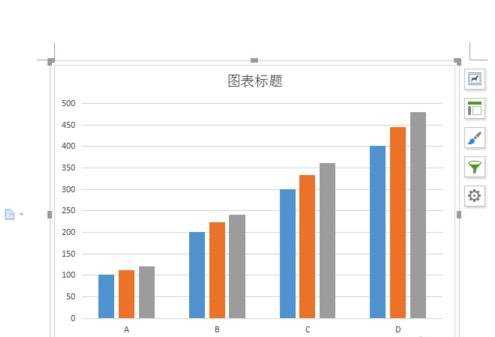
步骤三:根据自己的需求,选择合适的图表并点击,点击完在右侧有该图表的示意图,确定无误后点击”确定“(看下图)
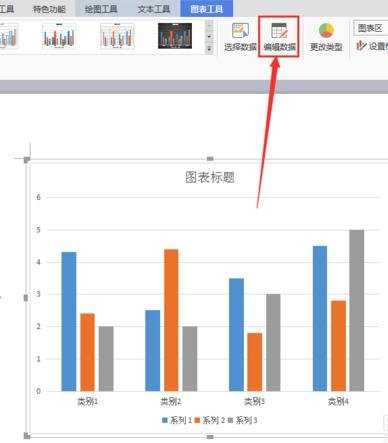
步骤四:现在来看,我们的条形统计图主体框架已经基本完成了,这样我们还需要编辑一下条形统计图的内容,点击菜单栏中的”编辑数据“继续(看下图)
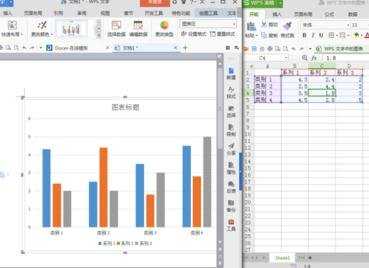
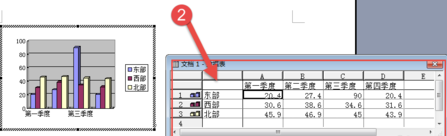
步骤五:点击完单栏中的”编辑数据“,系统会自动打开”Microsoft Excel工作表“(看下图),然后我们可以在”Microsoft Excel工作表“中编辑自己需要的数据(看下图2)
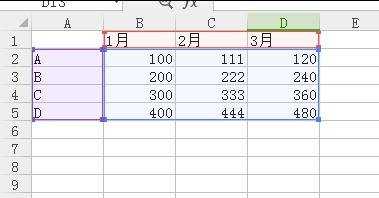
步骤六:在”Microsoft Excel工作表“中编辑完数据后,“Microsoft Word文档”中的条形统计图会自动调整为新数据(看下图)
步骤七:这样我们在“Microsoft Word文档”中制作条形统计图就完成了!
word插入统计图方法二:
步骤一:新建一个文档选择插入→图片→图表
步骤二:把默认的数据改成自己的,然后管关闭
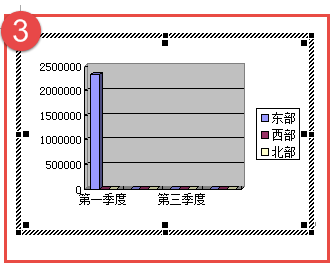
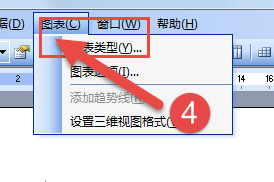
步骤三:如果改变图表类型就选择图表→图表类型
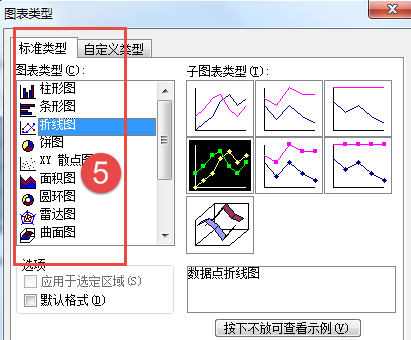
步骤四:在图表类型窗口,有许多种类的图表可以选择

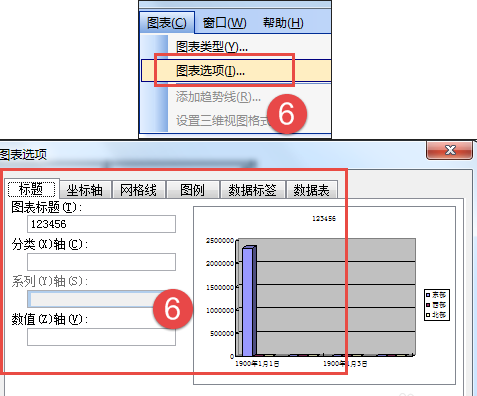
步骤五:选择图表→图表选项,可以修改图表的参数,如加个标题、改变图例位置等。
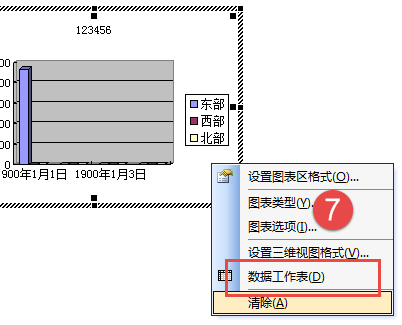
步骤六:想更改之前的数据,可以在图表上右击选择数据工作表
word怎么插入统计图的两种方法的评论条评论