
如何用excel统计区间分布的教程
发布时间:2016-11-09 16:31
相关话题
在Excel中,录入好数据后通常情况下需要进行统计数据,其中统计区间分布也是经常需要的,下面是由小编分享的如何用excel统计区间分布的教程,希望对你有用。
如何用excel统计区间分布的教程:
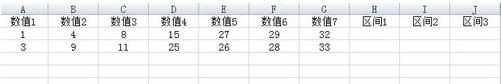
教程1:假设有这样两组数据,最小值为1,最大值为33,现在需要将其分为3个区间,分别是1-11,12-22,23-33。
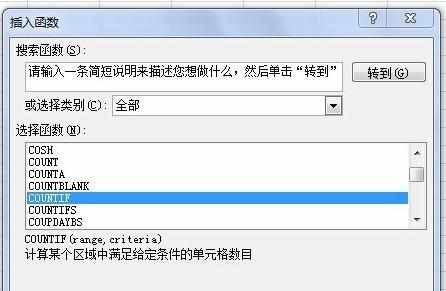
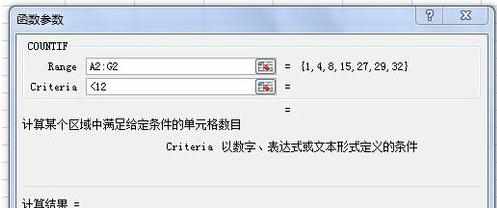
教程2:选中H2单元格,插入函数COUNTIF;在弹出的对话框中,序列栏选中A2-G2,条件栏输入<12,点击确定即可。如图所示,显示个数为3。
教程3:选中I2单元格,输入公式:=COUNTIF(B2:H2,"<23")-COUNTIF(B2:H2,"<12"),点击确定即可。
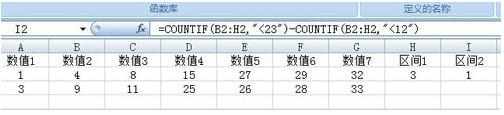
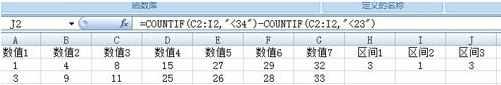
教程4:选中J2单元格,输入公式:=COUNTIF(B2:H2,"<34")-COUNTIF(B2:H2,"<23"),点击确定即可。
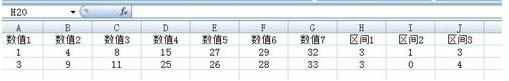
教程5:操作完毕后,可见H2-J2单元格分别显示3,1,3,即为各个区间的数值个数。进行下拉操作后,第二组数据同样可以得出区间个数。
看了如何用excel统计区间分布的教程还看了:
1.Excel员工工资的分布区间图
2.怎么统计Excel2013分类所占的百分比
3.Excel2013怎么统计一定范围的数值
4.怎么在excel2010中使用描述统计
5.怎么在excel中对数据进行统计
6.如何在excel中统计数据进行数据分析
7.用excel做统计分析教程
如何用excel统计区间分布的教程的评论条评论