
如何在word中画统计图表
发布时间:2016-12-01 23:03
相关话题
一般说来,Word主要用来进行文本的输入、编辑、排版、打印等工作;Excel主要用来进行有繁重计算任务的预算、财务、数据汇总等工作。画统计图表我们一般会用Excel,但是其实Word也可以画统计图表,其功能也不弱。
在word中画统计图表的步骤:
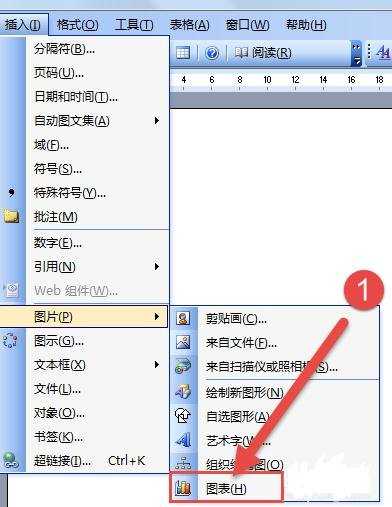
新建一个文档选择插入→图片→图表
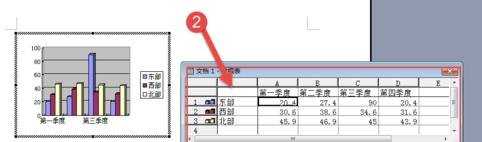
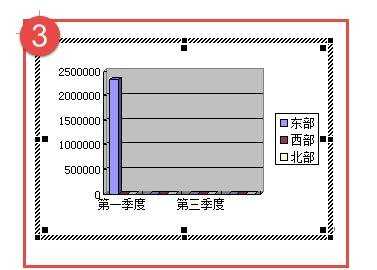
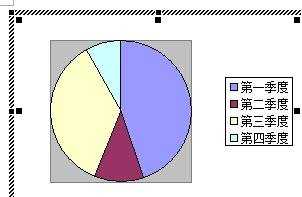
把默认的数据改成自己的,然后管关闭
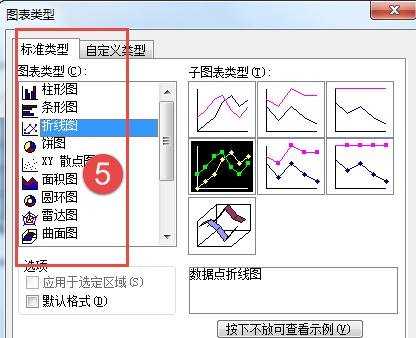
如果改变图表类型就选择图表→图表类型
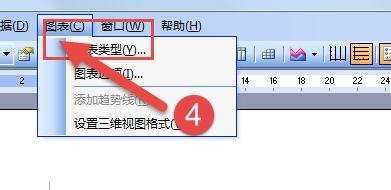
在图表类型窗口,有许多种类的图表可以选择
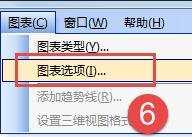
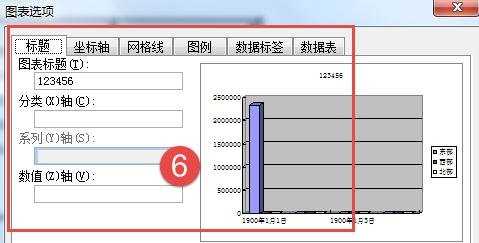
选择图表→图表选项,可以修改图表的参数,如加个标题、改变图例位置等。
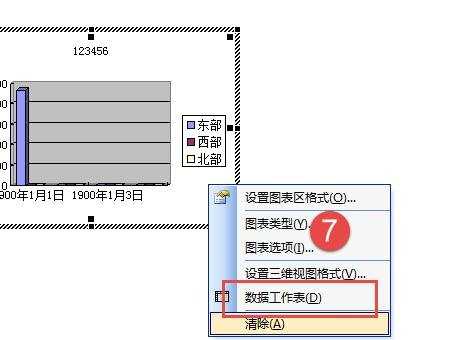
想更改之前的数据,可以在图表上右击选择数据工作表
如何在word中画统计图表的评论条评论