
怎么用excel2010对数据进行单因素分析
发布时间:2017-03-19 13:27
相关话题
单因素方差分析可以查看某个因素不同水平下对总体的影响,从而得出采用不同的方案,得出最佳效果。那么下面小编就教你怎么用excel2010对数据进行单因素分析。
用excel2010对数据进行单因素分析的步骤:
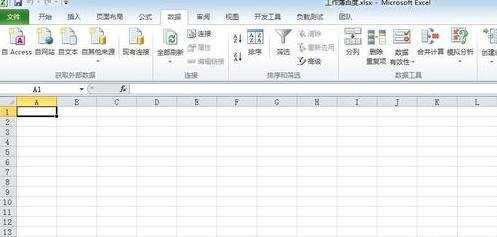
点击打开excel2010。
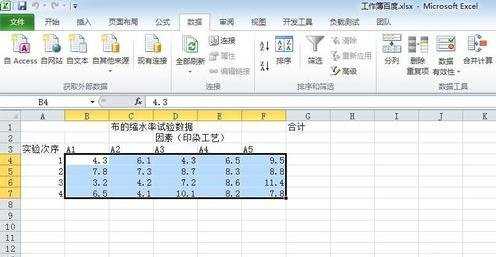
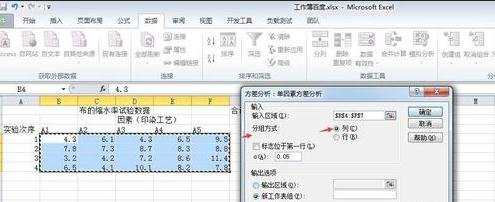
输入数据,以下图为列。选取五种印染工艺,每种工艺进行四次试验,分析不同的工艺对缩水率是否有影响。
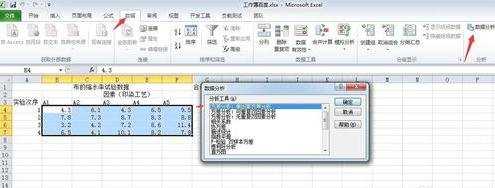
点击打开数据分析,选择单因素分析。
点击选定输入数据区域类型。
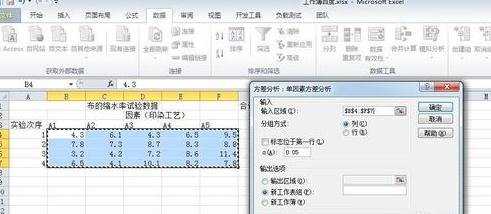
选择分组方式。注意!这里选择的是列,不懂的话,请注意看题
选择输出区域,这里随便你选定区域。
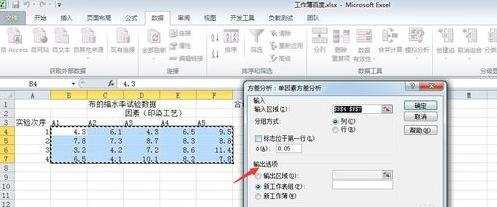
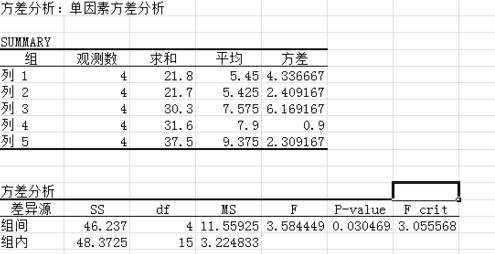
确定,得出分差分析表。
怎么用excel2010对数据进行单因素分析相关文章:
1.excel2010怎么对数据进行单因素分析
2.excel2010如何进行数据分析
3.在excel2010中怎么使用条件格式突出显示数据结果
4.excel2010怎么添加下拉列表
5.如何利用excel2010中建立数据透视表
6.Excel2010怎么对数据进行分区域锁定
怎么用excel2010对数据进行单因素分析的评论条评论