
excel怎么添加误差线
发布时间:2017-03-18 13:00
在绘制Excel时,会有图表的系列会表达的不够准确,数据之间存在误差,其实我们就可以给数据添加误差线,只有这样我们才能让自己的图表表达的更为准确。下面小编就教你怎么添加误差线吧。
excel添加误差线的步骤:
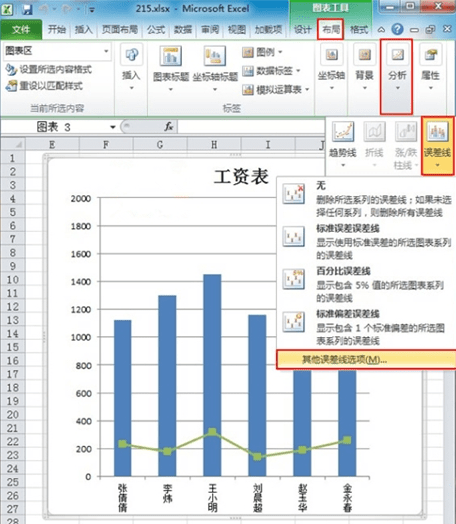
打开Excel图表,切换到“布局”选项卡,在“分析”组中单击“误差线”按钮,从下拉菜单中选择“其他误差线选项”选项;
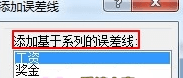
弹出一个“添加误差线”窗口,在“添加基于系列的误差线”功能框中选择“工资”;
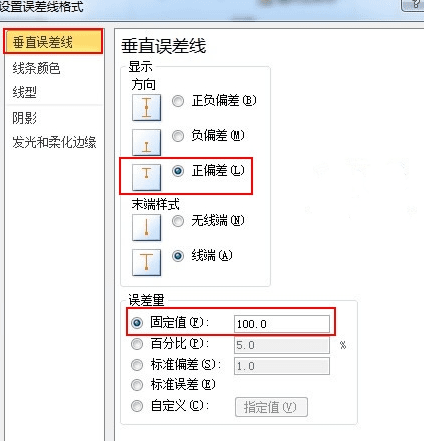
打开“设置误差线格式”对话框,在“显示”组合框中单击“正偏差”单选按钮,在“误差量”组合框中单击“固定值”单选按钮,在其右边的文本框中输入“100”;
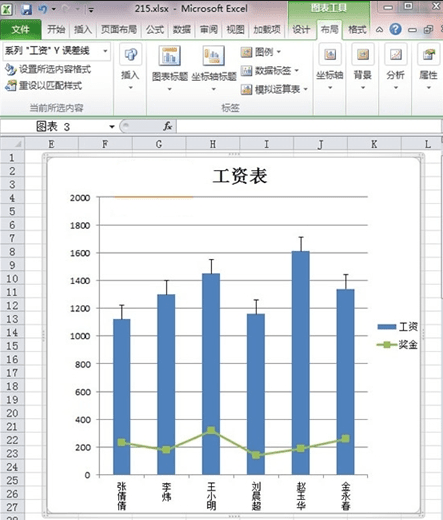
返回Excel编辑框,就可以看到工资这一系列被添加了误差线。
excel怎么添加误差线的评论条评论