
powerpoint怎么插入图表
发布时间:2017-01-09 16:13
相关话题
对于幻灯片的制作,怎么在幻灯片中插入图表呢?下面小编就为你介绍powerpoint怎么插入图表的方法啦!
powerpoint插入图表的方法:
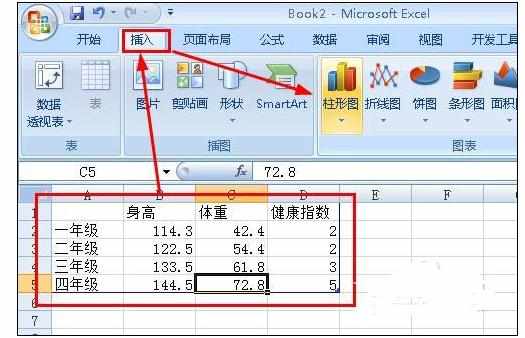
打开excel,建立一个表格,基于这个表格中的数据建立图表,点击插入——柱形图
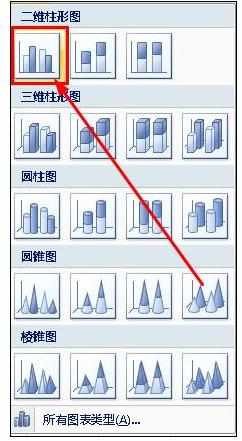
在打开的下拉列表中,我们选择一个样式
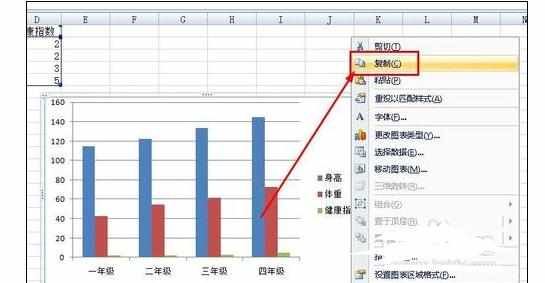
这样excel中建立了一个图表,我们右键单击这个图表,然后选择复制
切换到ppt中,我们右键单击空白的位置,然后选择【粘贴】
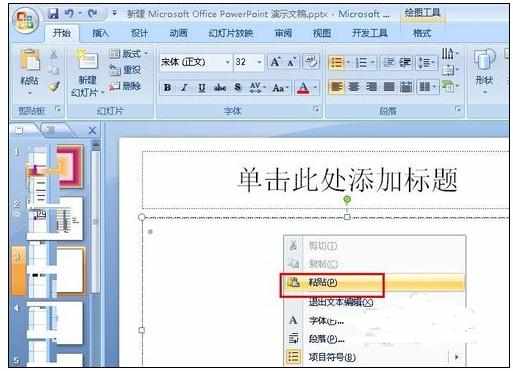
这样图表就插入到了ppt中,效果如下

在ppt中直接创建
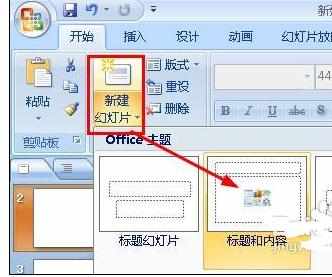
打开ppt以后我们先建立一个幻灯片,点击菜单栏上面的【新建幻灯片】---选择任意一个布局
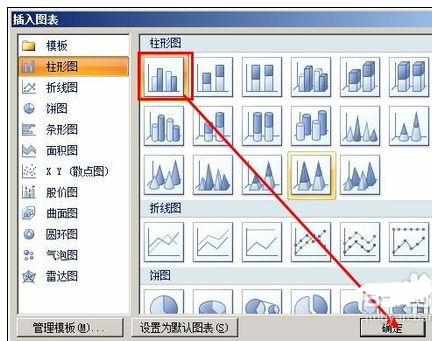
点击幻灯片中的图表的缩略图,这样就打开了插入图表的对话框

选择一个图表的样式,然后点击确定
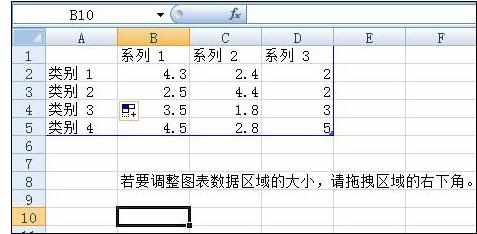
打开了excel表格,我们在这个表格中输入数据,这些数据就是用于建立我们的图表的,一开始给出了一些默认的数据,这些数据都是没用的,修改这些数据,改成你需要的图标,如下图中第二幅图
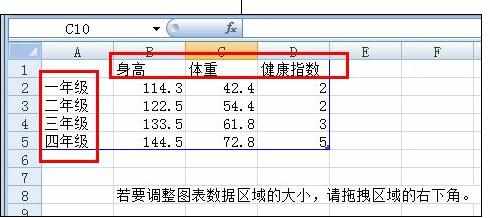
关闭excel,图表就自动创建了,我们看到这个图表就是刚才我们输入的那些数据建立的。

powerpoint怎么插入图表的评论条评论