
word中怎么做统计图
发布时间:2016-12-09 17:14
相关话题
画统计图表我们一般会用Excel,但是其实Word也可以画统计图表,其功能也不弱。那么下面就由小编给大家分享下word中做统计图的技巧,希望能帮助到您。
word中做统计图的步骤如下:
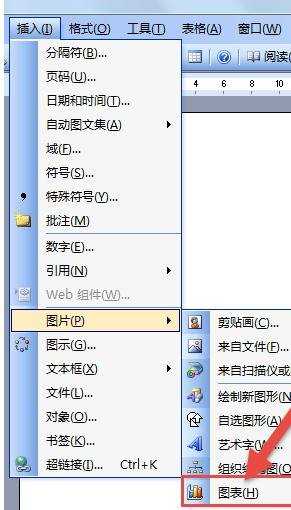
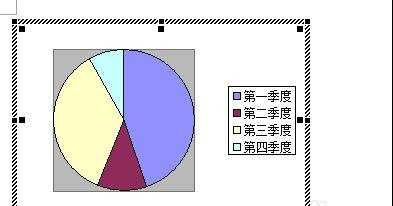
步骤一:新建一个文档选择插入→图片→图表
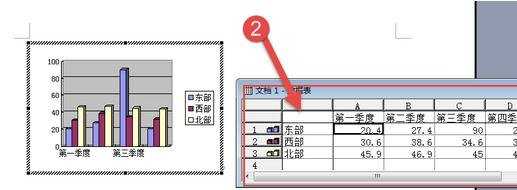
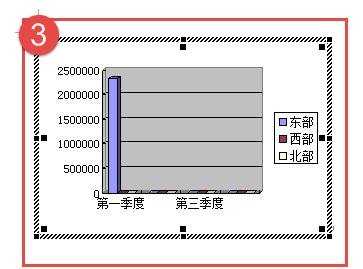
步骤二:把默认的数据改成自己的,然后管关闭
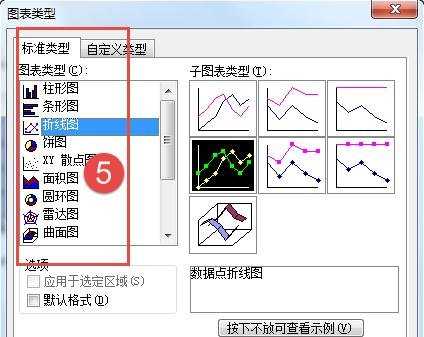
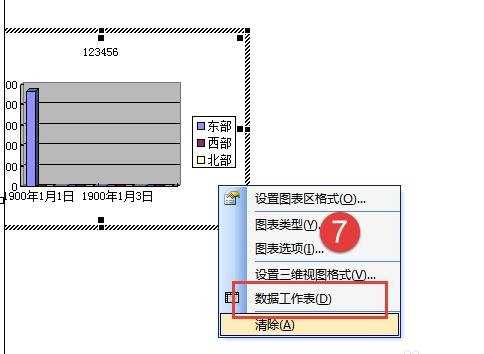
3步骤三:如果改变图表类型就选择图表→图表类型
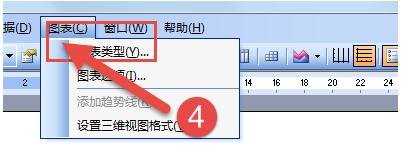
步骤四:在图表类型窗口,有许多种类的图表可以选择
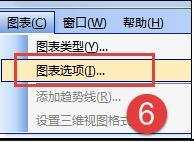
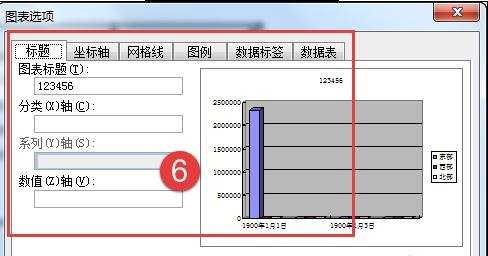
步骤五:选择图表→图表选项,可以修改图表的参数,如加个标题、改变图例位置等。
步骤六:想更改之前的数据,可以在图表上右击选择数据工作表
word中怎么做统计图的评论条评论