
excel双坐标轴格式的设置
发布时间:2017-05-11 16:09
相关话题
随着目前大数据时代的运用,目前对于数据的精确性要求越来越高,对于电脑操作水平同样如此,如何在同一图表中插入两个坐标系分析,对于数据本身是一个质的飞跃,一来方便数据的统计分析,二来方便读者的观察,这样的双坐标系进化在运用中将会越来越广范。今天,小编就教大家如何Excel设置双坐标轴格式的方法!
Excel设置双坐标轴格式步骤如下:
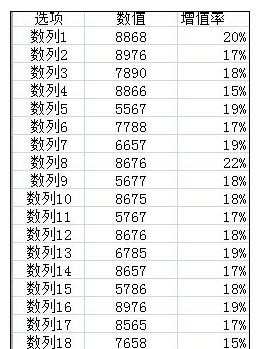
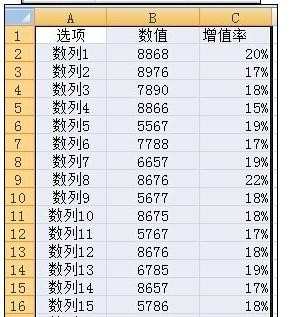
首先第一步按照要求导入原始数据,然后用鼠标选择所要制作图形区域,用鼠标左键单机选项,然后一直按住左键往右下角移动鼠标即可选中区域。
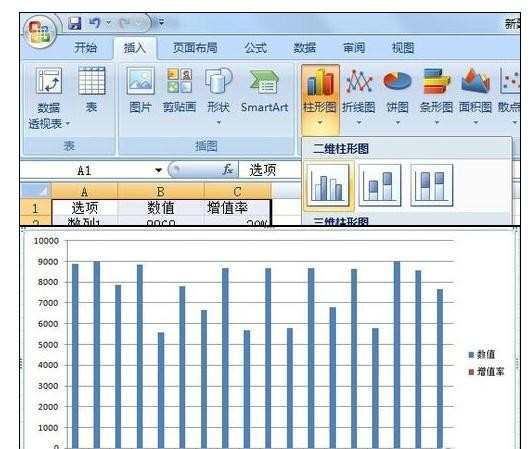
然后点击最上面对话框,插入,柱形图,第一个柱形图,然后便出现了柱状图。
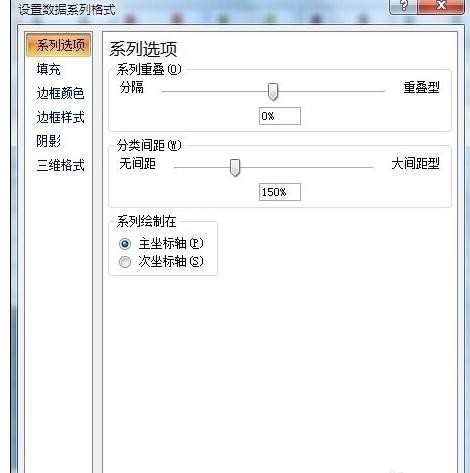
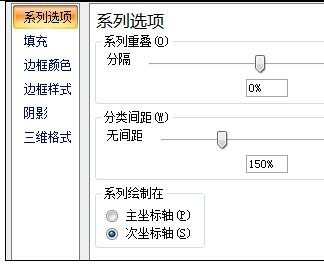
然后用鼠标左键点击数据,然后再点击右键,选择设置系列格式,然后会出现,系列格式对话框,选择右下角,次坐标轴。
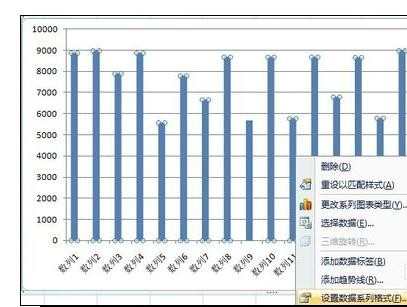
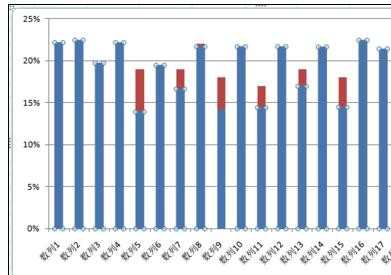
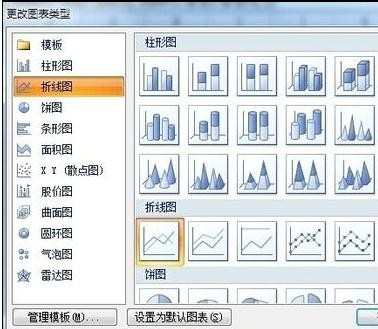
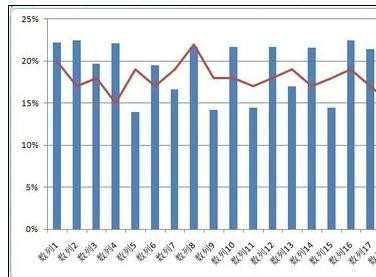
然后会出现这样的图形,因为我们刚开始选择的是柱状图,所以会出现不同颜色,但是没关系,鼠标左键点击图标上面红色部分图形,然后再点击右键,选择更改系列图表类型,然后选择折线图,即可然后点击确定。

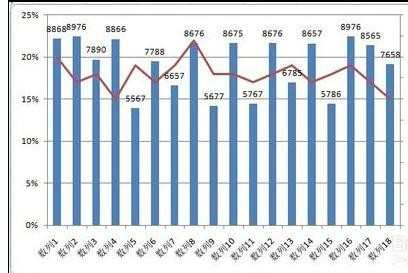
这样就会在图表中出现两个坐标,同时两种图形了,最后选中图表中的图形单击鼠标左键,然后再单击鼠标右键,选择添加数据标签,即可完成数据标识了。
excel双坐标轴格式的设置的评论条评论