
excel2010制作实验报告的方法
相关话题
在Excel中除了可以制作各种表格意外还可以用来制作实验报告,不知道各位朋友又是否知道可以这么做呢?不知道也没有关系,接下来小编为大家带来的excel2010制作实验报告的方法,供大家参考。
excel2010制作实验报告的方法:
制作实验报告步骤1:认真做完实验,看清楚对实验数据的要求。新建一个工作表,命名。


制作实验报告步骤2:一些不能用函数处理的东西可以用文字来进行表达。
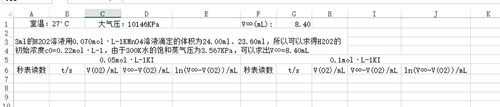
制作实验报告步骤3:输入你的实验数据
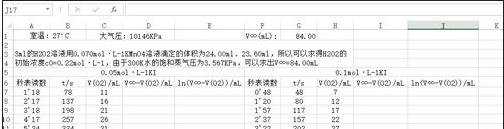
制作实验报告步骤4:按要求输入公式。

制作实验报告步骤5:完成一个数据的处理后,将光标置于该单元格右下角,直到出现一个小黑字,拖动光标至你需要的地方,如图所示。
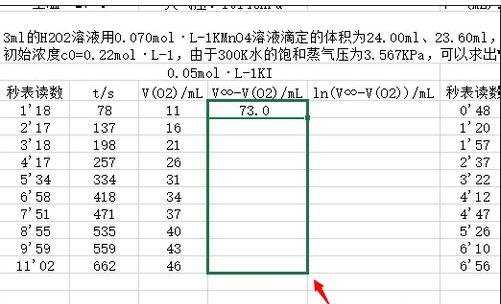
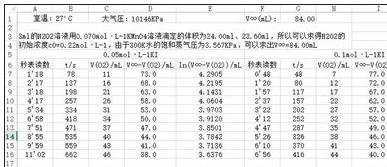
制作实验报告步骤6:按要求输入对数公式,如图。

制作实验报告步骤7:仿照步骤5、6,完成对数据的处理。
制作实验报告步骤8:接下来就是利用excel的最大便利之处了,作图。一般情况下,我们都是带有光滑曲线的散点图,如图所示。
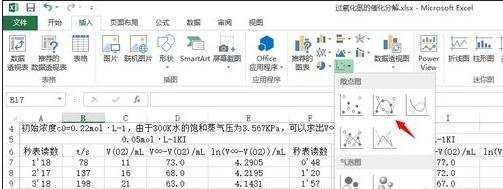
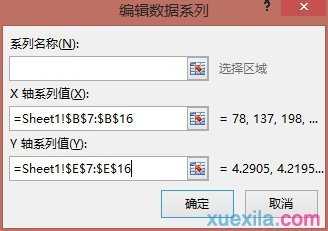
制作实验报告步骤9:右击,进行选择数据。

制作实验报告步骤10:用光标选择你需要的一行数字,注意x轴与y轴的内容。
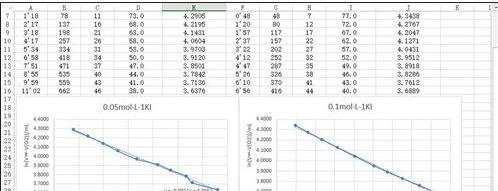
制作实验报告步骤11:当你导完数据后,你的目标曲线就出来了,这时候,我们完善这个图线。右击,选择我们需要的内容(如坐标轴标题)。

制作实验报告步骤12:选择线性趋势线,这样我们就可以得到我们想要的直线了。

制作实验报告步骤13:打开趋势线的更多选项,在显示公式的复选框中打钩,则可以显示该直线的方程,得到我们所求的斜率。

制作实验报告步骤14:仿照之前的步骤对另一组数据进行作图。完成。
制作实验报告步骤15:写好结论,记得点击保存。我们的数据处理完成,接下来打印上交就可以了。

看了excel2010制作实验报告的方法还看了:
1.如何用Excel2010制作图表
2.excel2010制作曲线图的方法
3.excel2010制作数据透视表的教程
4.excel2010制作多重饼图的方法
5.excel2010怎么制作数据透视表
6.excel2010怎么制作简单的扇形图
7.Excel2010教程
excel2010制作实验报告的方法的评论条评论