
excel2007设置图表颜色的方法
发布时间:2016-12-07 15:57
相关话题
Excel中经常需要使用到图表功能,图表中的颜色具体该如何进行设置呢?下面是由小编分享的excel2007设置图表颜色的方法,以供大家阅读和学习。
excel2007设置图表颜色的方法:
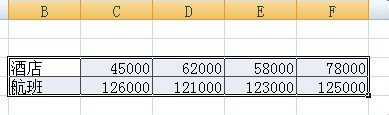
设置图表颜色步骤1:输入相关的数据。
设置图表颜色步骤2:按“插入”选项,在“图表”选项中选择“柱形图”。
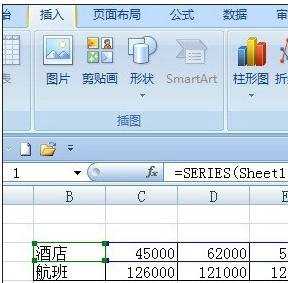
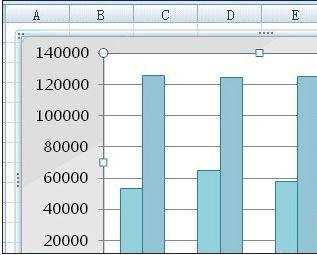
设置图表颜色步骤3:选择一种 最普通的二维柱形图。
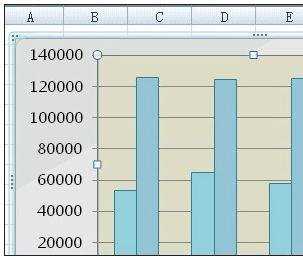
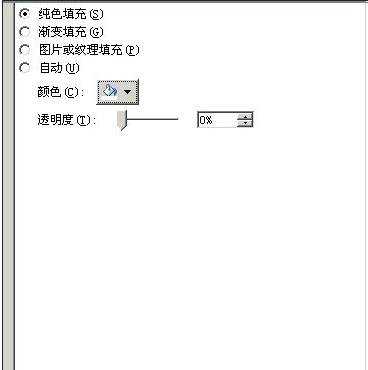
设置图表颜色步骤4:单击设置所选内容格式按钮。

设置图表颜色步骤5:从“颜色”下拉列表中,“主题颜色”部分选择“白色”。

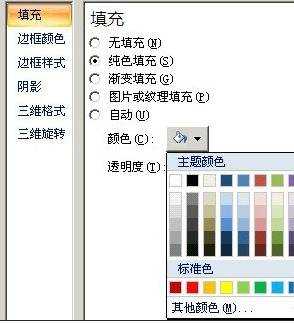
设置图表颜色步骤6:单击“关闭”。
设置图表颜色步骤7:这时可以看到,图表绘图区的颜色已经更改成白色了。
看了excel2007设置图表颜色的方法还看了:
1.怎么修改Excel2007中图表样式
2.怎么给excel的表格设置颜色
3.Excel如何给表格框添加颜色
4.excel 2007制作图表的方法
5.怎么修改Excel2007网格线的颜色
6.Excel图表负值怎么设置不同颜色
7.excel表格标签颜色设置的教程
excel2007设置图表颜色的方法的评论条评论