
excel制作柱形图表的教程
相关话题
Excel中经常需要使用到图表功能,其中柱形图表具体该如何制作呢?下面是小编带来的关于excel制作柱形图表的教程,希望阅读过后对你有所启发!
excel制作柱形图表的教程:
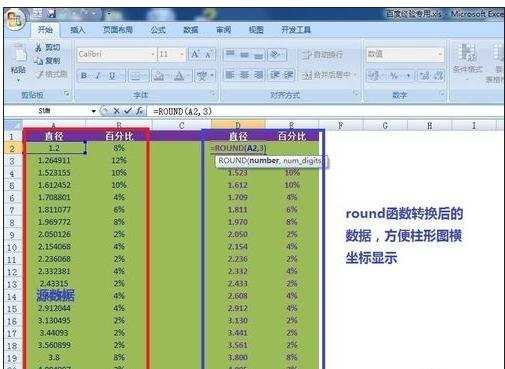
制作柱形图表步骤1:复制数据到excel,然后对源数据进行处理,由于excel是以直径为横坐标的,所以还需要对横坐标值进行小数位的省略,否则就会导致柱形图横坐标异常丑陋。小数位的省略请使用round(单元格,小数位)来做。
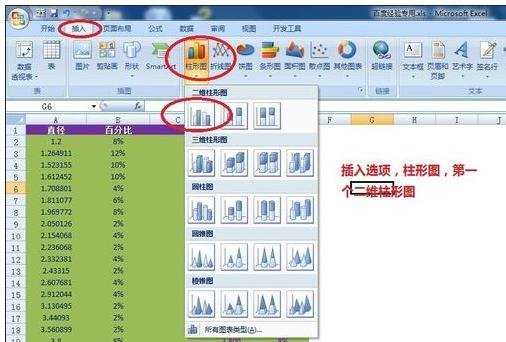
制作柱形图表步骤2:然后,选择插入选项卡,点击柱形图选项,下拉菜单中选择第一个柱状图,如图所示。
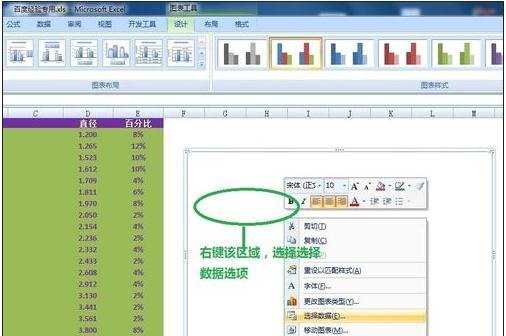
制作柱形图表步骤3:在空白图区域单击右键,选择“选择数据”如图所示
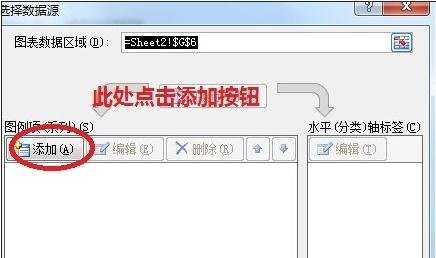
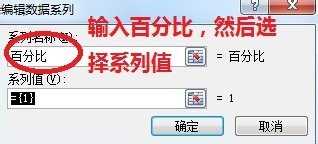
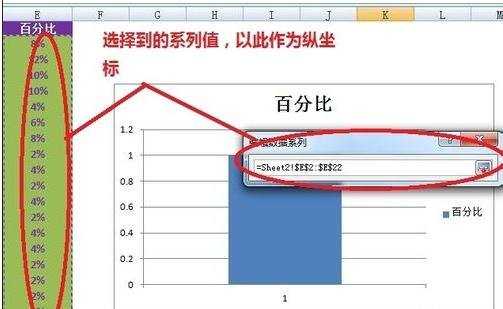
制作柱形图表步骤4:在弹出的页面中,选择下图所示的添加按钮。在弹出的新对话框中,输入百分比系列,然后选择系列值。
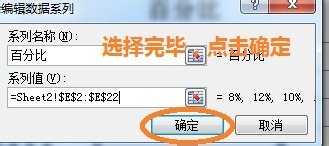
制作柱形图表步骤5:选择完毕后,点击确定按钮。
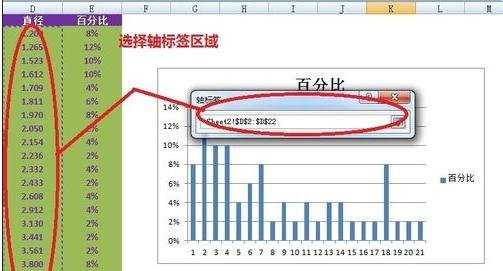
制作柱形图表步骤6:在下图的对话框中,继续选择编辑按钮,在弹出的轴标签对话框中选择轴标签区域。同样点击确定按钮
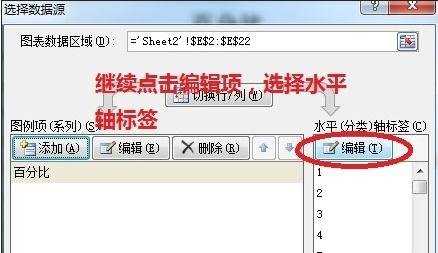

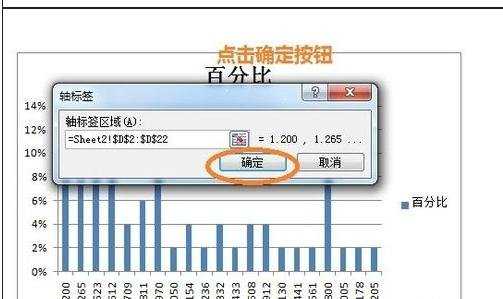
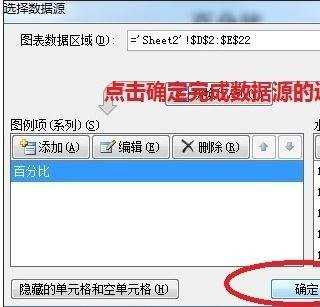
制作柱形图表步骤7:选择好轴标签后,点击确定按钮,完成数据源的选择。
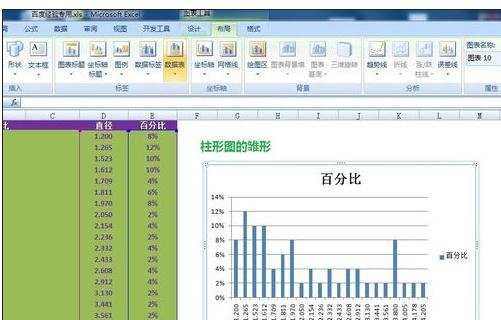
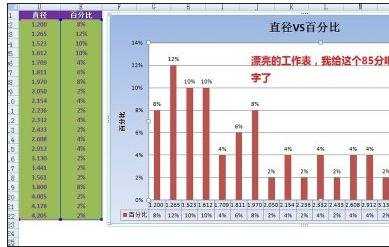
制作柱形图表步骤8:我们大致就做好了这个柱形图,但是如果我是老板或者看报告者,我肯定给这个报告60分,它只是满足了我的使用,并没有满足我的视觉。请接着看第二步骤。
制作柱形图表步骤9:选中我们的图形,点击设计标签,选择布局5,这个布局的好处在于有详细的title和坐标轴,以及相对应的数据显示,非常直观漂亮。我一般优先选择。 修改坐标轴名称和坐标标题。

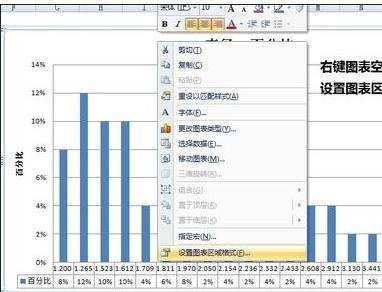
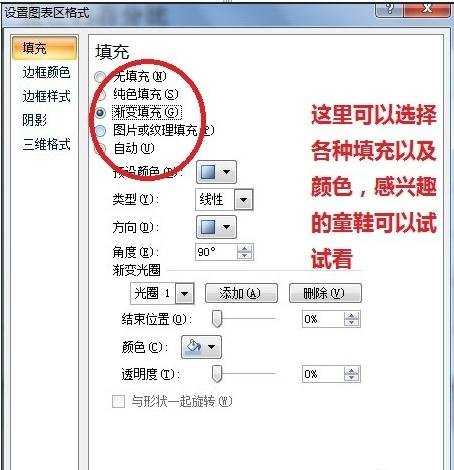
制作柱形图表步骤10:修改完毕后,右键图表空白区域,在弹出的菜单中,选择设置图表区域格式,在填充中,选择渐变填充。在下面你可以选择渐变颜色以及效果。选择完毕,点击确定
制作柱形图表步骤11:左键选中所有柱形,右键,在弹出的菜单中,选择添加数据标签,然后所有的柱形图就拥有自己的标签了。

制作柱形图表步骤12:同时在上面设计,图标样式中,选择自己喜欢的颜色。为你的柱形图穿上漂亮的新衣。

制作柱形图表步骤13:最后精美的柱形图出来了。开始时这位同学的问题也完美解决了。见效果图。
看了excel制作柱形图表的教程还看了:
1.excel2003制作柱形图的教程
2.excel柱形图制作教程
3.Excel制作图表教程
4.excel2010 柱形图的制作教程
5.Excel2013中怎么制作柱形目标进度图
6.怎么在excel2010中创建柱形图
7.Excel制作图表的教程
excel制作柱形图表的教程的评论条评论