
excel统计函数的基本用法
发布时间:2016-11-07 12:02
相关话题
Excel中经常需要使用到函数进行数据的统计,统计函数具体该如何使用呢?接下来是小编为大家带来的excel统计函数的基本用法,供大家参考。
excel统计函数的基本用法:
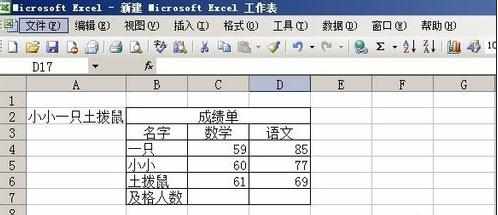
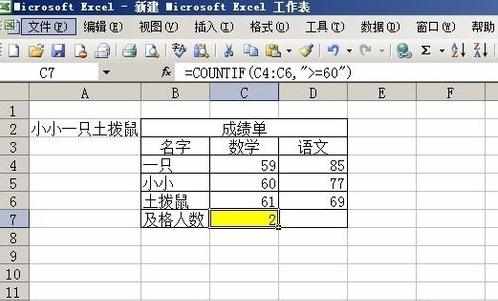
统计函数使用步骤1:打开需要统计的Excel文件。
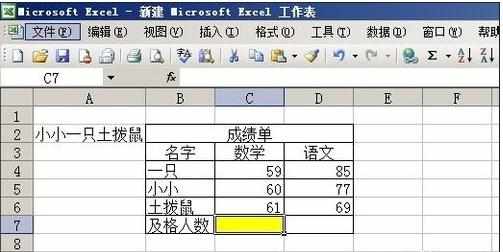
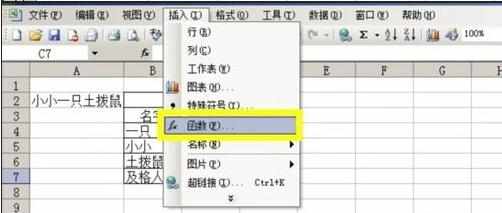
统计函数使用步骤2:把鼠标移至“及格人数”旁的空格,即黄色那里。点击菜单栏的“插入”,选择“函数”。
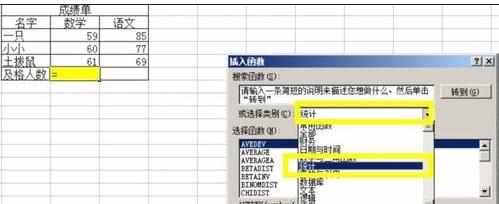
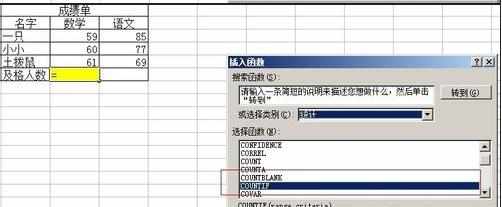
统计函数使用步骤3:在弹出的窗口中选择“统计”函数,然后在下方选择“COUNTIF”。这个表示会统计满足给定条件的单元格的数目。
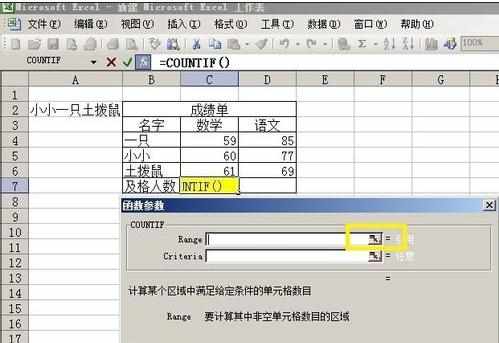
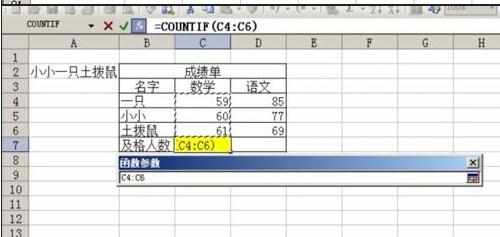
统计函数使用步骤4:之后会弹出一个窗口,在Range选择需要统计数据的单元格,可以点击黄色方框里来选择统计数据的范围。选完之后回车即可。
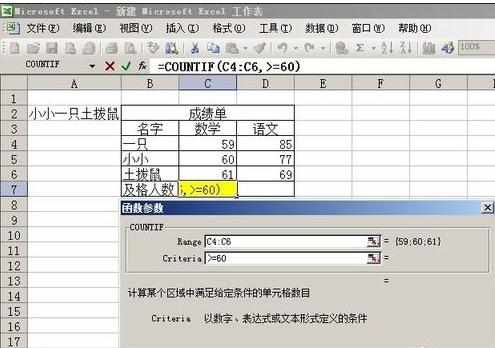
统计函数使用步骤5:然后在Range下面输入条件,因为是及格,那么就输入>=60即可。然后按确定就可以了。
看了excel统计函数的基本用法还看了:
1.怎么在excel2013中使用统计函数
2.怎么在excel中使用函数计算
3.excel 数据统计函数使用实例
4.excel 计数公式count的使用教程
5.Excel平均值及计数函数的用法
6.excel用函数统计有效数据个数的方法
7.教你如何使用Excel函数 统计成绩分数
excel统计函数的基本用法的评论条评论