
excel2010怎么创建迷你图_excel2010迷你图怎么制作
发布时间:2017-06-17 05:50
相关话题
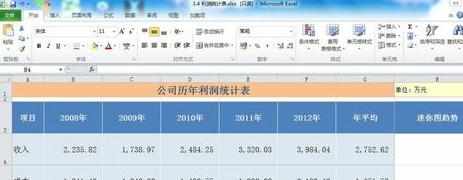
我们在使用Excel2010的过程中,适当用迷你图可以显示一系列数值的趋势,最能突出显示的最大值和最小值,下面是小编整理的excel2010创建迷你图的方法,供您参考。
excel2010创建迷你图的方法
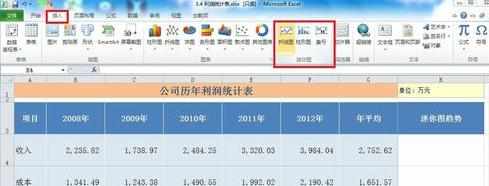
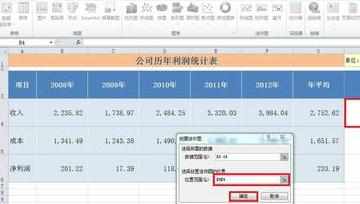
打开需要编辑的资料,单击H4单元格,在“插入”选项卡的“迷你图”中,选择迷你图的类型。
打开“创建迷你图”。
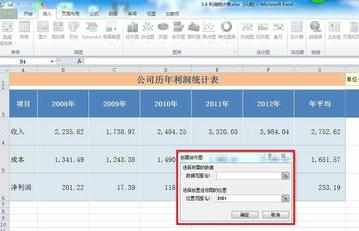
在“数据范围”中,输入基于数据的单元格区域,如图中的单元格区域B4:F4,其中的目的就是对2008-2012年的收入趋势进行反映。
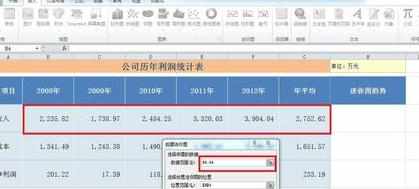
在“位置范围”框中指定迷你图的放置位置,默认的情况下单元格不做改变,单击“确认”。
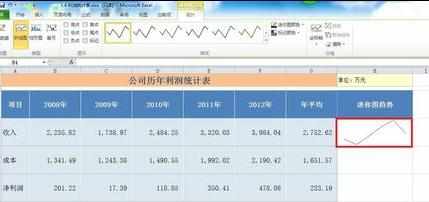
在H4单元格中输入文本“收入趋势图”,并且可以调整字体大小颜色。
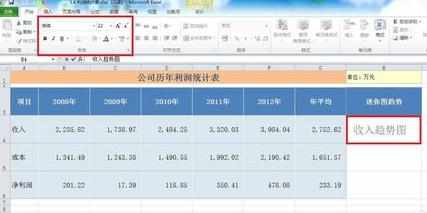
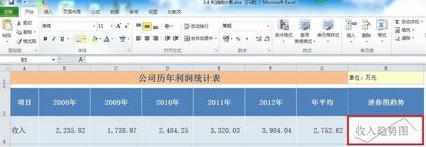
这样,创建迷你图就做好了。
excel2010怎么创建迷你图_excel2010迷你图怎么制作的评论条评论