
excel2013中如何制作组合图表
发布时间:2017-06-05 11:21
在excel的使用中,我们有时候需要在将多个图表结合在一起,这样能更方便得查看其中的数据信息,那么要怎么做才能组合图表,下面给大家分享excel2013中制作组合图表的方法。
excel2013中制作组合图表的方法
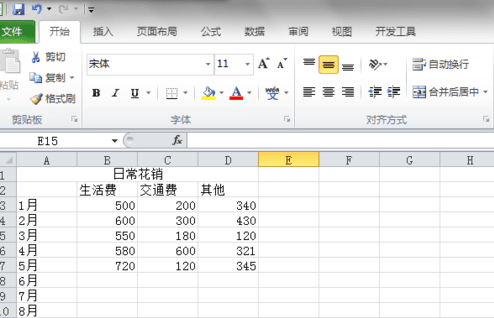
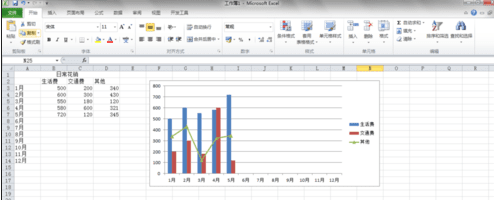
首先制作基础表格,以每月花销举例。
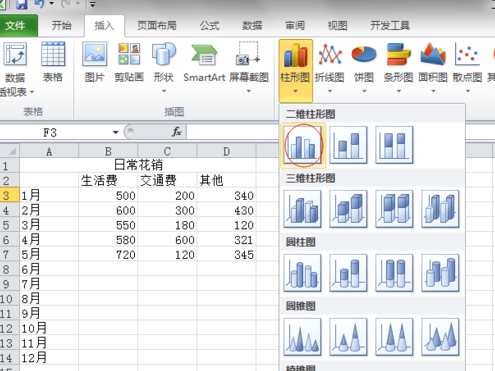
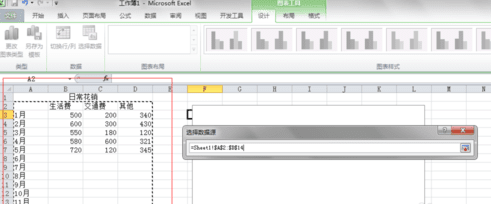
插入图表,并在“设计”下面点击“选择数据”
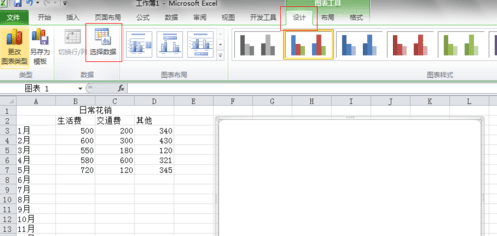
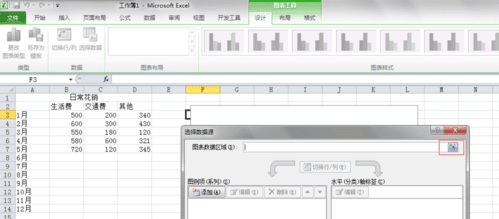
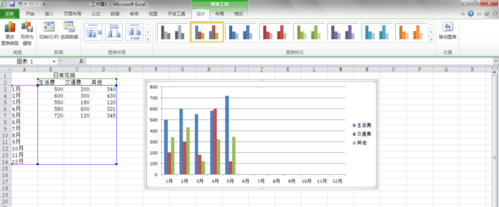
选择“图表数据区域”,选择数据区域,回车,确定,生成图表。
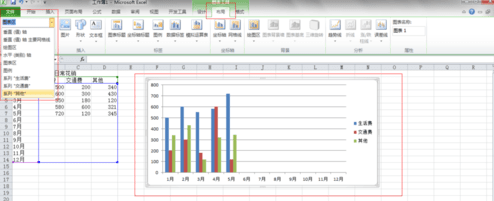
下面将“其他”费用转换为折线图。
1)、选中图表,在菜单栏中“布局”,点击左上角下拉框,选择“其他”;
2)、选择“设计”-“更改图表类型”,选择折线图,确定。
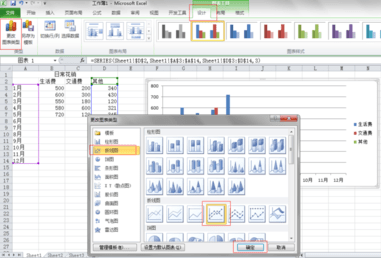
完成。
猜你感兴趣:
1.excel2013如何绘制组合图表
2.怎么在excel2013中制作组合图表
3.如何在excel2013中制作一个复合饼图
4.怎么在excel2013中制作复合饼图
5.excel如何制作组合图表
excel2013中如何制作组合图表的评论条评论