
如何在ppt中做图表
发布时间:2016-12-10 16:54
相关话题
除了Excel表格,在PPT中Excel的图表运用也很广泛,那如何在ppt中做图表呢,小编为你支招,希望对你有所帮助。
在ppt中做图表的方法
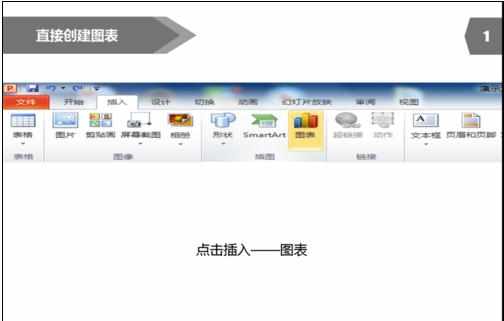
1.直接在PPT中创建图表,点击插入图表
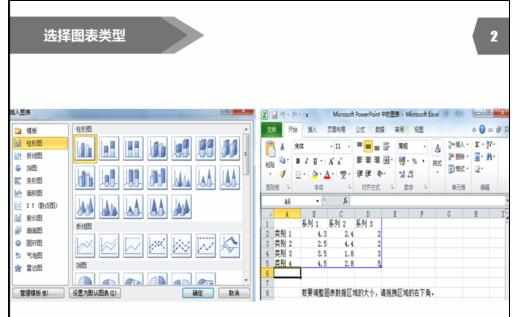
2.选择图表类型——确定,然后自动进入Excel编辑界面。
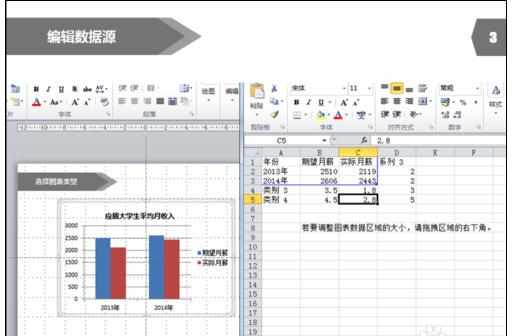
3. 编辑数据源,若要调整图表数据区域的大小,请拖拽区域的右下角,如图所示。
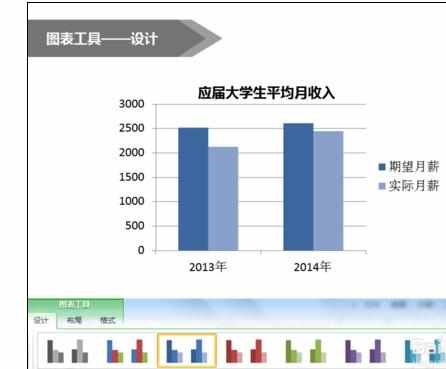
4.通过图表工具——设计,可以对图表的颜色等进行设置。
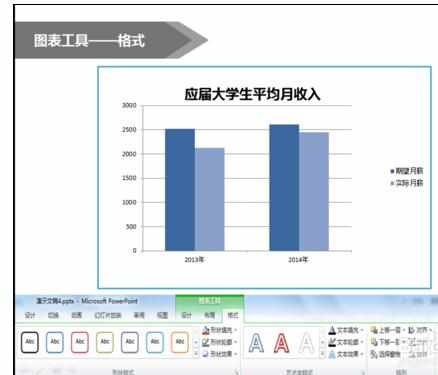
5.通过图表工具——格式,可以对图表的外变现框进行设置。
如何在ppt中做图表的评论条评论