
excel表格组合图表的方法
发布时间:2016-12-23 23:08
相关话题
Excel中经常需要使用到组合图表功能,组合图表具体该如何操作呢?接下来是小编为大家带来的excel表格组合图表的方法,供大家参考。
excel表格组合图表方法:
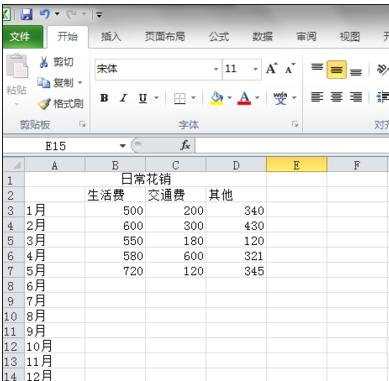
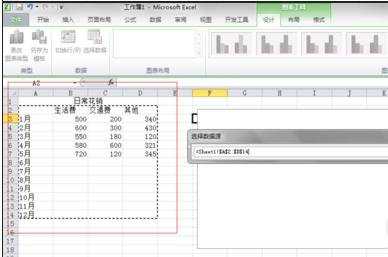
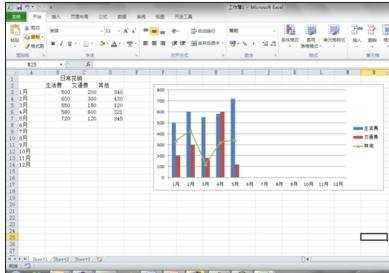
组合图表步骤1:首先制作基础表格,以每月花销举例。
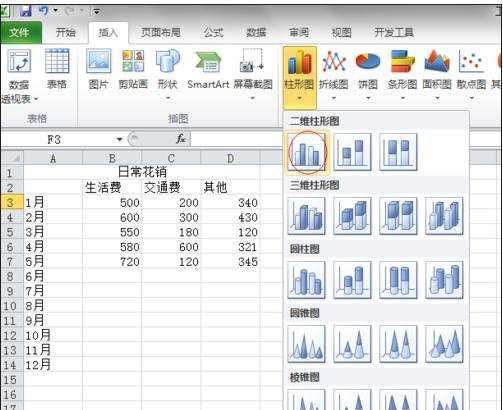
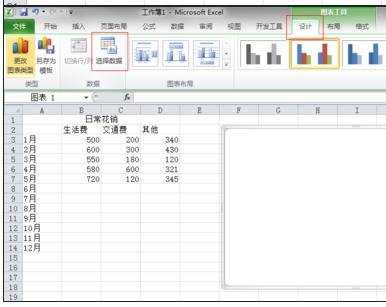
组合图表步骤2:插入图表,并在“设计”下面点击“选择数据”
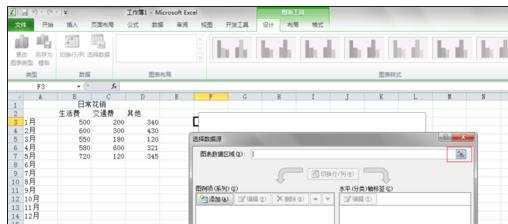
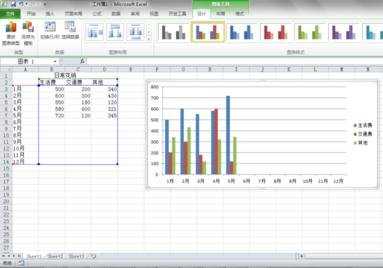
组合图表步骤3:选择“图表数据区域”,选择数据区域,回车,确定,生成图表。
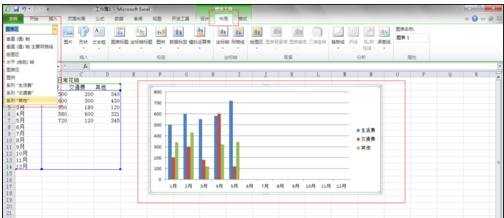
组合图表步骤4:下面将“其他”费用转换为折线图。
1)、选中图表,在菜单栏中“布局”,点击左上角下拉框,选择“其他”;
2)、选择“设计”-“更改图表类型”,选择折线图,确定。
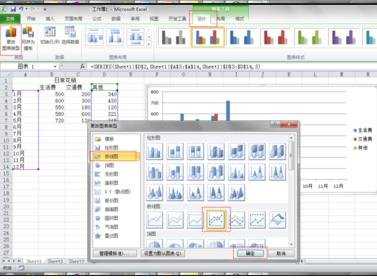
组合图表步骤5:完成。
看了excel表格组合图表的方法还看了:
1.怎么在excel2013中制作组合图表
2.excel2007创建组合图表的方法
3.怎么用Excel制作复杂组合图表
4.excel表格嵌入图表的方法
5.如何合并excel图表教程
6.Excel怎么把图片何合并进你的图表
7.如何在excel中制作图表的方法(含两个版本)
excel表格组合图表的方法的评论条评论